CS 109 NBA Basketball Logan Kerr, Eric Lu, Jeff Wang, Annie Yang
Visualizing data
A large portion of our project was dedicated to exploring and visualizing elements of our data. Scroll down to get a taste of some of our work!
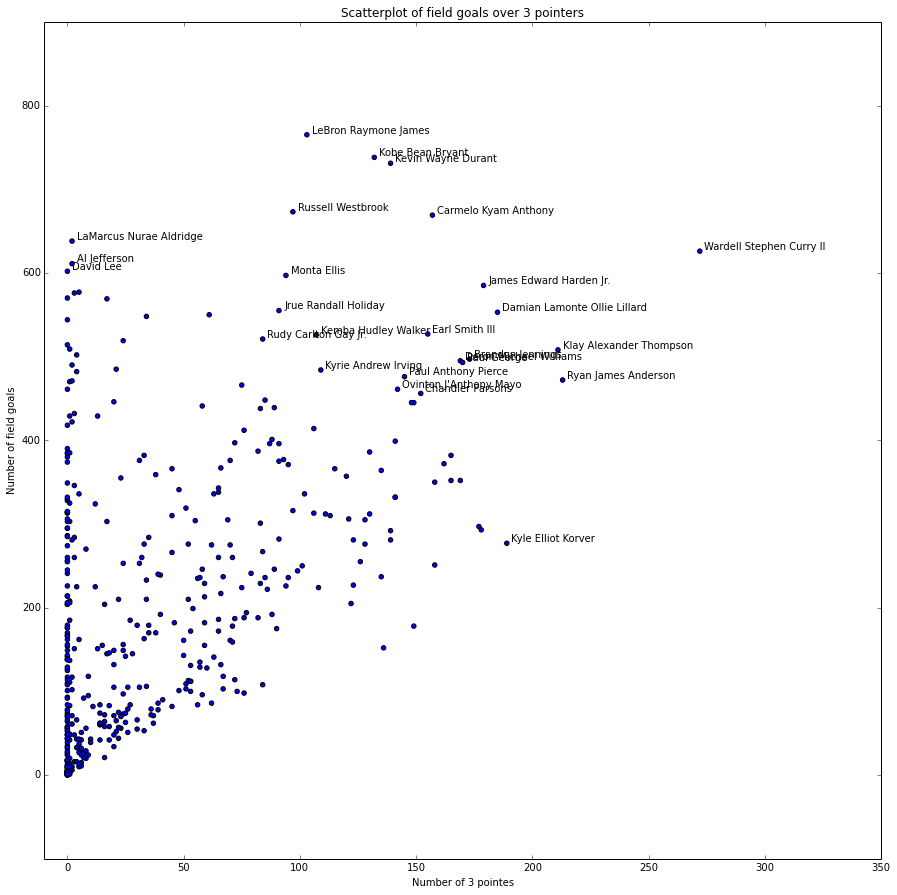
Scatter plot of field goals versus 3 pointers in 2012-13 season
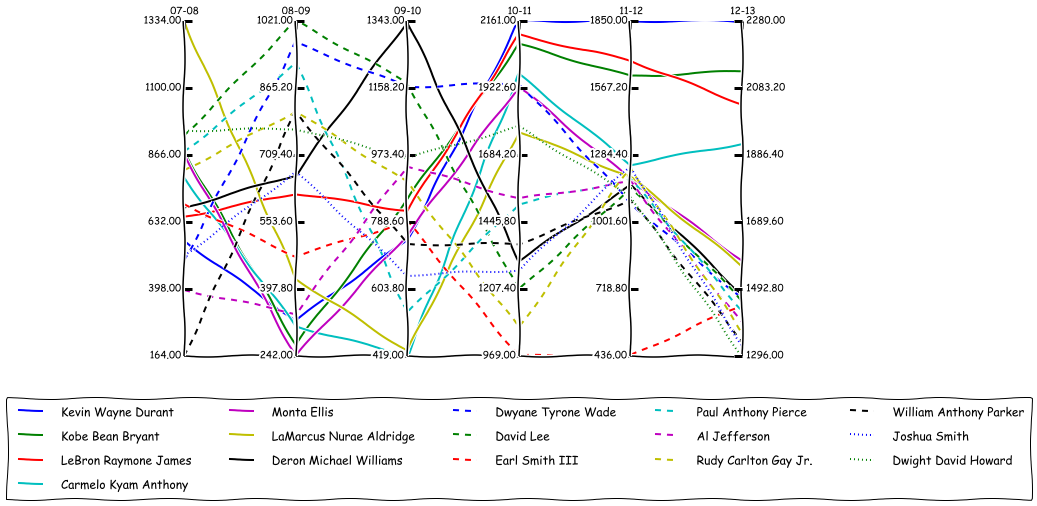
Time plot of top scorers since the 2007-08 season
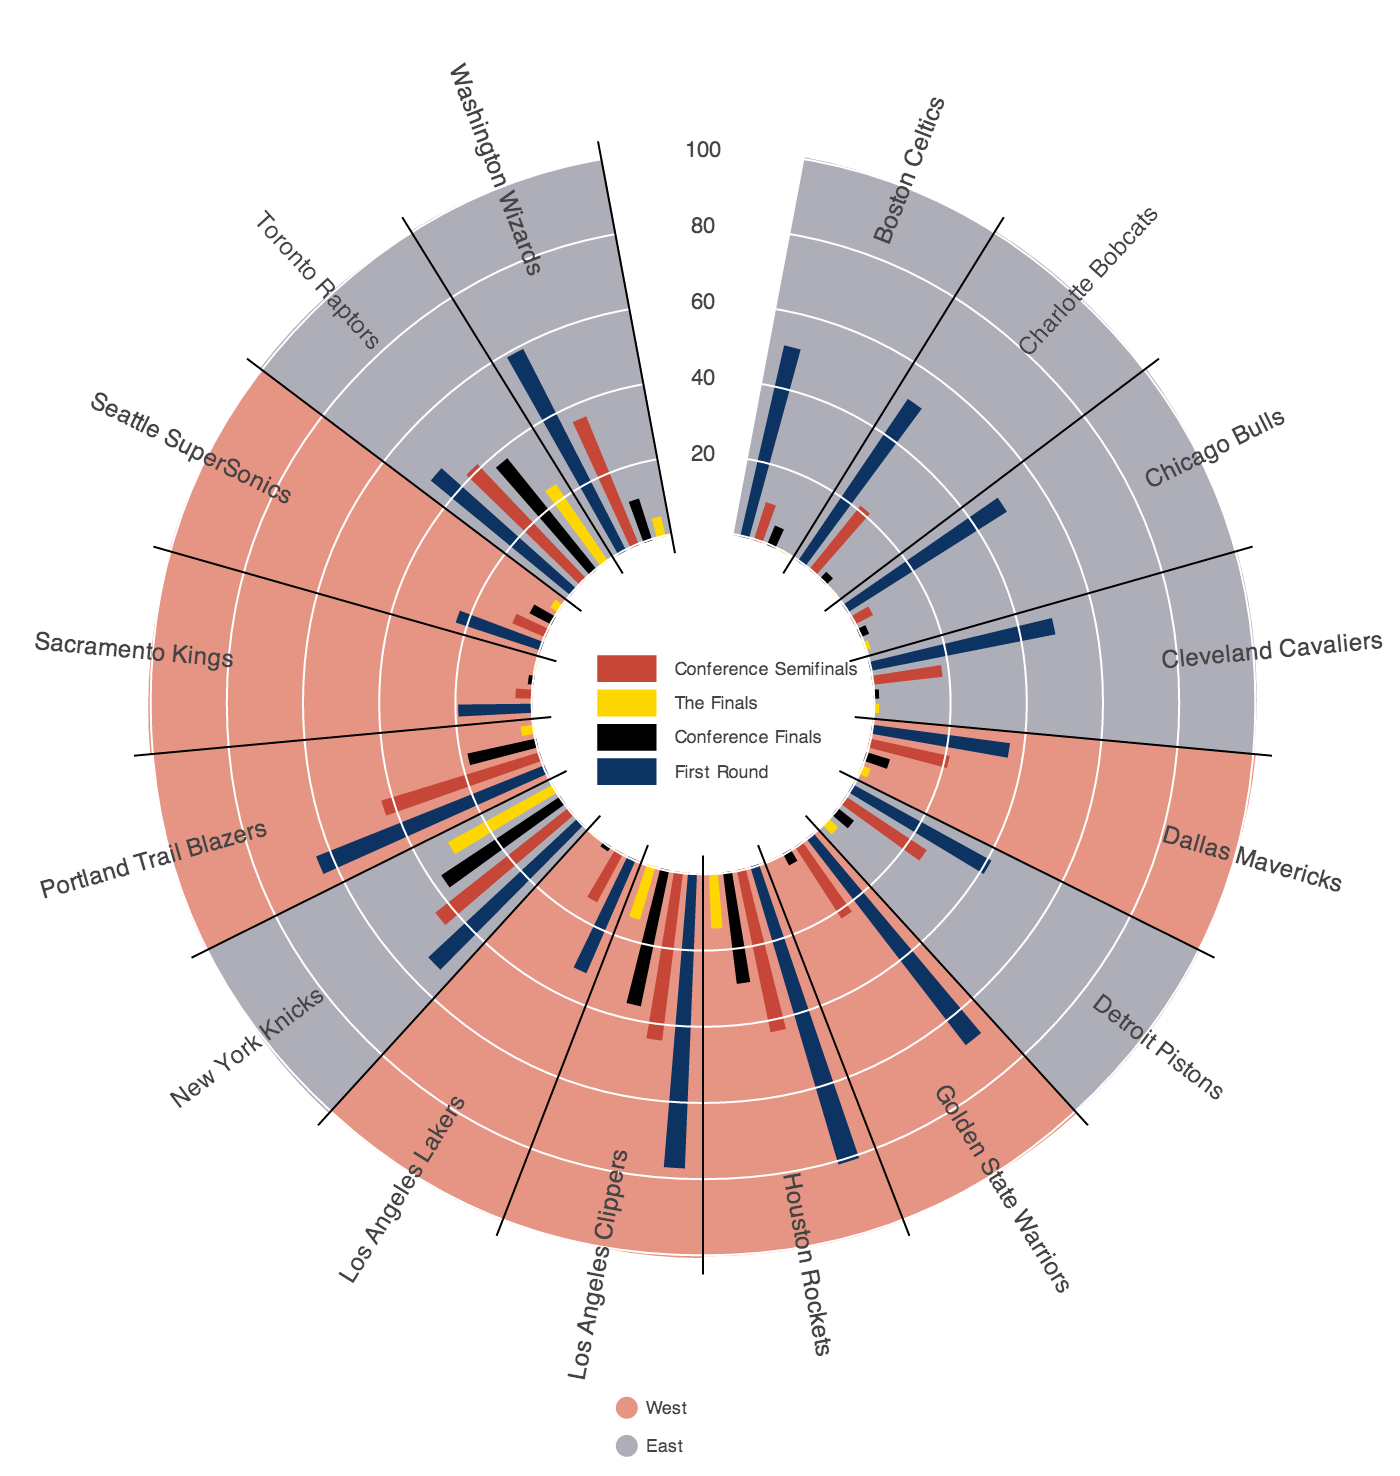
Bokeh plot of the likelihoods of teams of making it to different rounds in the playoffs
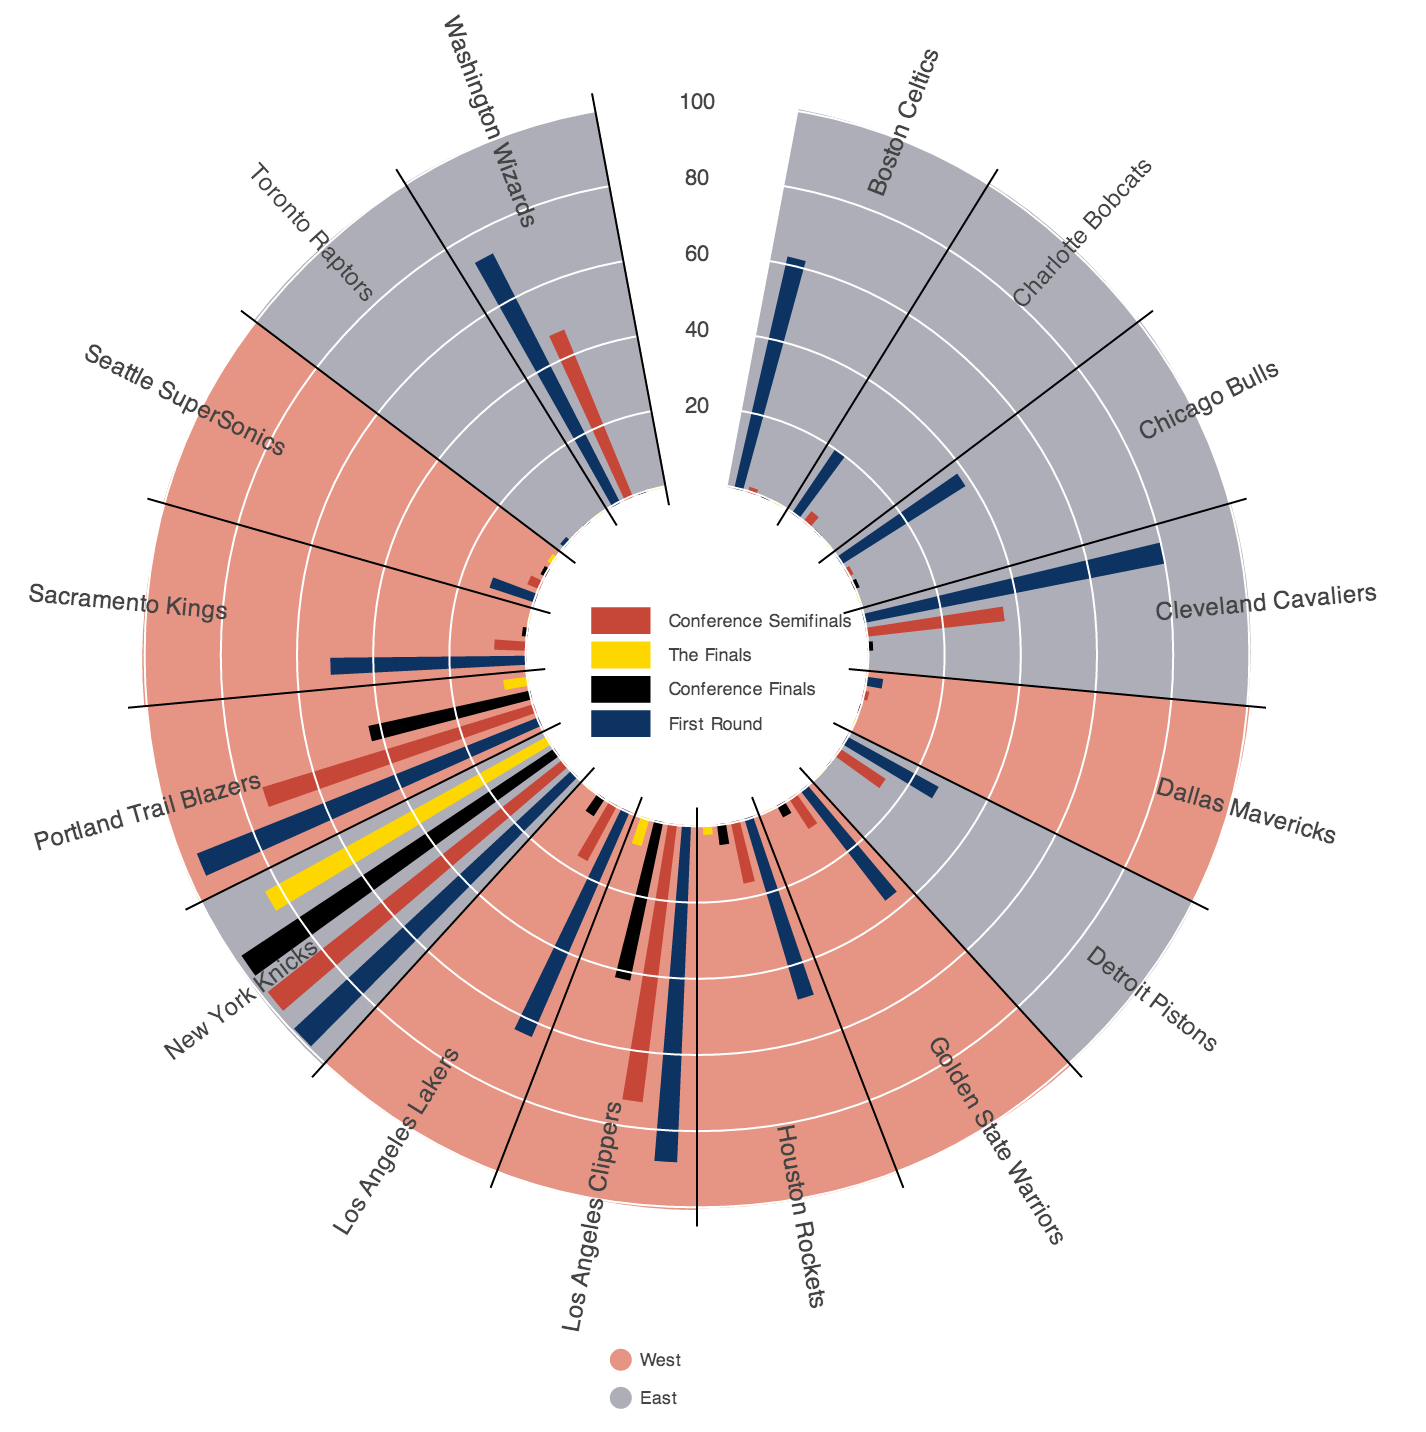
Bokeh plot of the likelihoods of teams of making it to different rounds in the playoffs